Monitoring Wheelchair-Related Physical Activities in Older Adults in Nursing Care Facilities
Amol M Karmarkar,MS1-3 ; Diane M Collins,PhD1-3 ; Michelle L.Tolerico,MS1-2 ; Rory A Cooper, PhD1-3
1 Human Engineering Research Laboratories, VA Pittsburgh Healthcare System, Pittsburgh, PA
2 Department of Rehabilitation Science and Technology, University of Pittsburgh
3 Engineering Research Center on Quality of Life Technology (QoLT), Pittsburgh, PA
ABSTRACT:
Lack of evidence regarding wheelchair use in nursing care facilities limits prescription guidelines. The purpose of this study was to monitor wheelchair-related physical activities for older adults in nursing care facilities. Thirty two residents, who were able to self-propel their wheelchairs, without cognitive impairments, were enrolled from two facilities: Southwestern Veterans Center (n=16) and Presbyterian Senior Care at Southmont (n=16). A wheelchair datalogger was used for collecting data on wheelchair use. The datalogger was placed on each resident’s wheelchair for a period of one month. Data were reduced and compared between two facilities using t-tests, Fisher’s exact statistics, and computing correlation coefficients. Results indicated higher but significantly less efficient use of wheelchairs by the Southmont group as compared to the SWVC group. Wheelchair use is identified as a result of cumulative interaction of demographics, health-related, and wheelchair-related factors.
KEYWORDS:
Older adults, Nursing Care Facilities, Manual Wheelchairs, Physical Activities
INTRODUCTION:
Physical inactivity is considered as one of the significant factors for increased level of disability and mortality in the older population.(1) A previous study indicated three times higher odds of mortality for older adults with physical impairments living a sedentary life style, as compared to those without impairments living an active life style.(1) High prevalence of low mobility is also often observed in older adults hospitalized or in Nursing Care Facilities (NCF). A cycle of low mobility causing functional dependence, resulting in increased use of personal assistance, leading to higher chances of hospitalization (nursing facilities) has been reported earlier.(2)
Approximately 1.8 million community dwelling, older individuals use wheelchairs (WC), with 58% of this population being manual wheelchair (MWC) users.(3) In NCF the number of older individuals using WC is reported to be over 50% of the total population.(3) Irrespective of the reasons for use, utilization of WC in terms of how often, when, where and the purpose of their use remains unresolved. Measuring level of physical activity for individuals with disability and the aging population has been a challenging task. Literature reported use of over 30 different methods (observations, physical activity questionnaires, pedometers, heart rate monitors, accelerometers, and calorimetery) for assessing levels of physical activity.(4) Assessment of WC-related physical activities was done primarily through subjective assessments, questionnaires and survey. There is inadequate research related to actual monitoring of physical activities using wheelchairs.(5) In NCF research related to use of WC was done using observational strategies. A study by Brechtelsbauer and Louie (1999) reported maximum use of WC by NCF residents during their mealtime, and suggested that the use of WC as a mobility device is inappropriate for this population.(3)
RESEARCH QUESTIONS:
- What is the level of Wheelchair-related physical activities for older adults in the SWVC facility and in the SM facility?
- What impact do factors including demographics, health of residents, and characteristics of their wheelchairs, have on their wheelchair-related physical activities?
METHODS:
Protocol:
The study was longitudinal in nature monitoring WC-related physical activities in a NCF for a period of one month. For this paper, data from two NCF: Southwestern Veterans Center and Presbyterian Senior Care at Southmont are presented. The study protocol was approved by the VA Institution Review Board (IRB). All participants were screened and consented prior to their enrollment in the study.
Participants:
Thirty two residents (N=32) living at either one of the two NCF were enrolled. Inclusion criteria for the study were: age 60 and above, using MWC for mobility, and a Mini Mental Status Examination (MMSE) score ≥ 22.
Outcomes:
For monitoring WC-related physical activities, a WC datalogging device was placed on each resident’s WC for one month. A data logger (DL) featured an internal clock, eight megabytes of flash memory, and a lithium battery. A pendulum sensor was used to trigger event recording. Each time a WC wheel rotates more than 120 degrees, the time of the motion event is recorded with one tenth second accuracy Analysis: Data were processed in two steps, with first step used for data reduction. For that purpose customized programs using Matlab software were developed and used. This provided data for variables: WC use, speed of propulsion, stops taken per 25 meters, total endurance distance, active WC use per hour. Time proportion was determined for three WC propulsion speeds: speed > 1m/s; between .5-1m/s; and <.5m/s. Continuous and categorical demographic variables were compared between SWVC and SM facilities using independent t-tests and Fisher’s exact statistics. Data regarding WC-related physical activities was compared using independent t-tests. To determine interaction between different variables, correlation coefficients (Pearson/Spearman) were computed. All the statistical analyses were done using SAS 9.01, with a level of 0.05.
RESULTS:
Demographics:
Participants from the SWVC facility were significantly younger (p=.012), with less comorbidities and physical impairments as compared to those from the SM. A significantly higher proportion of female population represented the SM facility as compared to the predominantly male population from the SWVC (p<.001). Also, participants from the SWVC facility were using better quality WC as compared to those from the SM facility (p=.04).
|
SWVC |
SM |
p |
|---|---|---|---|
Age (years) |
77±9.30 |
84.3±5.6 |
t=.012* |
Comorbidities |
1.43±.96 |
2.18±1.22 |
t=.06 |
Physical Impairments |
4.37±1.89 |
5.43±1.59 |
t=.09 |
| t= Independent t test, *= statistically significant difference at a=0.05 | |||
|
|
SWVC |
SM |
p |
|---|---|---|---|---|
Gender |
Male |
14 |
4 |
x2<.001* |
Female |
2 |
12 |
||
Diagnosis |
Cerebro Vascular Accident |
7 |
2 |
x2=.07 |
|
Parkinson’s Disease |
0 |
2 |
|
|
Other |
9 |
12 |
|
WC Type |
K01 |
1 |
6 |
x2=.04* |
|
K04 |
15 |
10 |
|
WC Propulsion† |
Arms |
3 |
7 |
x2=.26 |
|
Legs |
3 |
1 |
|
|
Arms & Legs Combination |
9 |
8 |
|
| x2 = Fisher’s’s Exact statistics, *= statistically significant difference at a=0.05, † indicates missing data | ||||
WC-Related Physical Activities:
Average use of WC was higher for participants from the SM facility (0.74km) as compared to those from the SWVC (0.66km). However, in terms of speed of propulsion the SWVC group was faster (0.64m/s) compared to the SM group (0.53m/s). Also, the SWVC group was pushing their WC for greater portion of time over 1m/s as compared to those in the SM group (12 versus 1%, p=0.04). Participants from the SWVC group also presented with higher WC propulsion endurance indicated by fewer stops per 25 meters of distance covered (4 versus 7), and greater distance covered before making a stop, as compared to those in the SM group (61 versus 49meters).
|
SWVC |
SM |
p |
|---|---|---|---|
Average Distance Traveled (m) |
660.32±372.2 |
740.43±456.6 |
.59 |
Average Speed of Propulsion (m/s) |
.64±.19 |
.53±.20 |
.15 |
Stops Taken/25m |
4.20±3.9 |
7.10±4.7 |
.78 |
Average Endurance Distance (m) |
61.75±22.7 |
49.75±15.7 |
.12 |
Average Active Use/hour (min.) |
17.05±12.2 |
26.54±16.8 |
.11 |
Propulsion Speed >1m/s (%) |
12.01±15.3 |
1.67±2.73 |
.04* |
Propulsion Speed Between .5-1m/s (%) |
44.09±31.6 |
32.20±34.7 |
.37 |
Propulsion Speed <.5m/s |
40±42.05 |
64.8±32.3 |
.12 |
| t= Independent t test, *= statistically significant difference at a=0.05 | |||
Relationships:
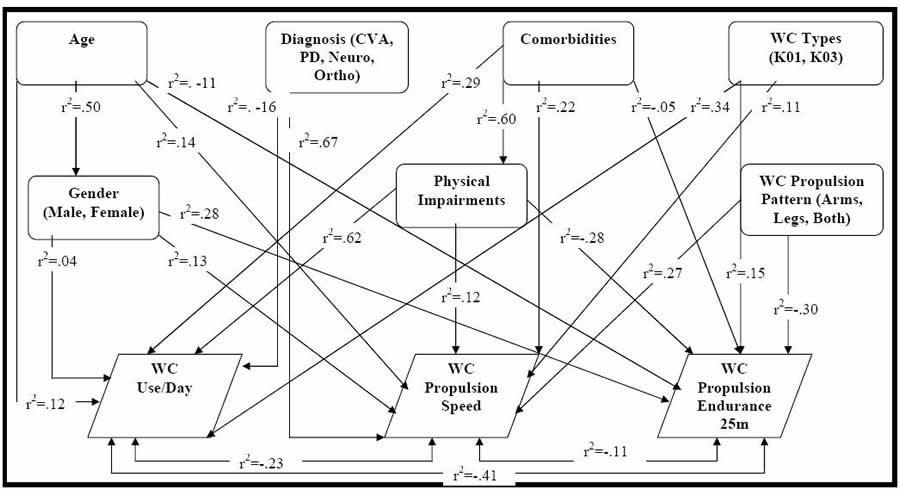
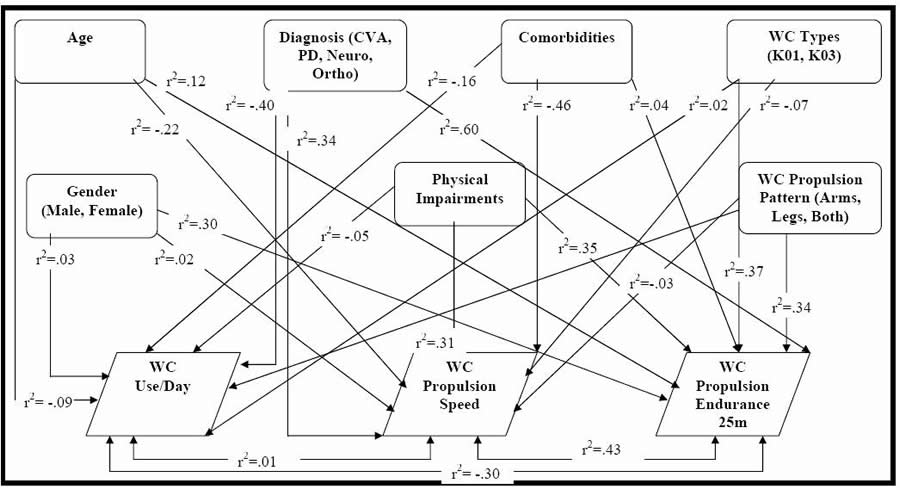 Figure 1. Relationships between Variables in SWVC & SM (Click for larger view)
 The relationships between variables were determined separately for each NCF. For the residents of SWVC facility, a moderately positive relationship was observed between physical impairments and average use of WC (r2=.62); and between diagnosis and speed of WC propulsion (r2=.67). For the residents of SM facility, a moderate relationship was observed between diagnosis and number of stops taken per 25 meters (r2=.60).
DISCUSSION:
Demographically, participants from the SM facility were older, with more comorbidities, and higher level of physical impairments, as compared to those from the SWVC facility. Also, a higher proportion of female population represented the SM facility as compared to the SWVC. The SWVC group was using a better quality WC (K04), with higher proportions of residents using legs, or arms plus legs combination, method of propulsion, as compared to the SM participants.
For WC related physical activities, although the average use of WC was higher for the SM group, the SWVC group was identified to be more efficient in WC propulsion. This is supported by the data related to speed and endurance of WC propulsion. Unlike the study by Simmons et al. which reported a low speed (.2m/s) and endurance (6.2 min) for this population,(6) our participants were propelling their WC with a speed from .53-.66m/s.(6) The differences between the SWVC and the SM group, may be due to the fact that the SWVC group was predominantly younger male population, with fewer impairments and using better quality WC as compared to the SM group. Physical impairments, were identified as one of the factors, affecting WC-related mobility by Tolerico and colleagues.(5) However, other factors that could impact WC-related mobility have not been looked at by previous studies.
The results, related to the relationships between the variables in the current study, suggested that for both facilities, WC-related physical activities depend on several factors. Rather, the mobility outcomes are a result of interaction between (a) demographic factors (such as age, gender, etc.), (b) health-related factors (such as medical conditions, comorbidities, physical impairments, etc.), (c) WC characteristics (such as quality of WC, etc.); and (d) user-technology interaction. Previous studies failed to explain this relationship, thus indicated use of WC as a mobility device as inappropriate, limiting the mobility of older adults in NCF.(3, 6) The dataloggers from SWVC indicated greater speeds of WC mobility recordings for residents with extensive neurological impairments. This is explained by the passive propulsion of WC; that is, WC propulsion by the caregiver staff for transporting the residents within the facility. In the SM facility, on the other hand, the residents, with greater neurological impairments, were using WCs with small strokes, and with greater number of stops for every 25 meters of distance covered.
Data regarding WC-related activities was a combination of active use (residents using their WC) and passive use (someone propelling the WC for residents). The DL device is not sensitive enough to make this distinction. In the future, a data reduction program could be generated to make this demarcation in the data. Secondly, the data were collected from only two NCF, which could compromise the accuracy of generalized results applicable to the entire NCF aging population. Finally, the comparative analysis regarding WC-related activities was done ignoring confounding effects of factors such as age, gender, comorbidities, physical impairments etc. Although the interaction models suggest these relationships, a statistical control during making comparisons would be critical, and can be addressed as part of secondary analyses.
REFERENCE:
- Hirvensalo, M., Rantanen, T., Heikkinen, E.(2000). Mobility difficulties & physical activity as predictors of mortality & loss of independence in the community-living older population. Journal of the American Geriatrics Society, 48(5),493-498.
- MacRae, P.G., Schnelle, J.F., Simmons, S.F., Ouslander, J.G.(1996). Physical activity levels of ambulatory nursing home residents. Journal of Aging and Physical Activity, 4(3),264-78.
- Brechtelsbauer DA, Louie A.(1999). Wheelchair use among long-term care residents. Annals of Long-Term Care, 7(6),213-220.
- Warms, C.(2006). Physical activity measurement in persons with chronic and disabling conditions: Methods, strategies, and issues. Family and Community Health, 29(SUPPL. 1),78S-88S.
- Tolerico, M.L., Ding, D., Cooper, R.A., Spaeth, D.M., Fitzgerald, S.G., Cooper, R., Kelleher, A., Boninger, M.L.(2007). Assessing mobility characteristics and activity levels of manual wheelchair users. Journal of Rehabilitation Research and Development, 44(4),561-572.
- Simmons, S.F., Schnelle, J.F., MacRae, P.G., Ouslander, J.G.(1995). Wheelchairs as mobility restraints: predictors of wheelchair activity in nonambulatory nursing home residents. Journal of the American Geriatrics Society, 43(4),384-388.
ACKNOWDEGMENT:
The study is funded by ERC on QoLT (#EEC 0540865) and VA Center of Excellence on WARE (#B3142C and # H0001).
Amol M. Karmarkar, 7180 Highland Drive building 4, 2nd floor, East Wing, 151R-1 Pittsburgh, PA,15206. karmarkara@herlpitt.org (412)-365-4902